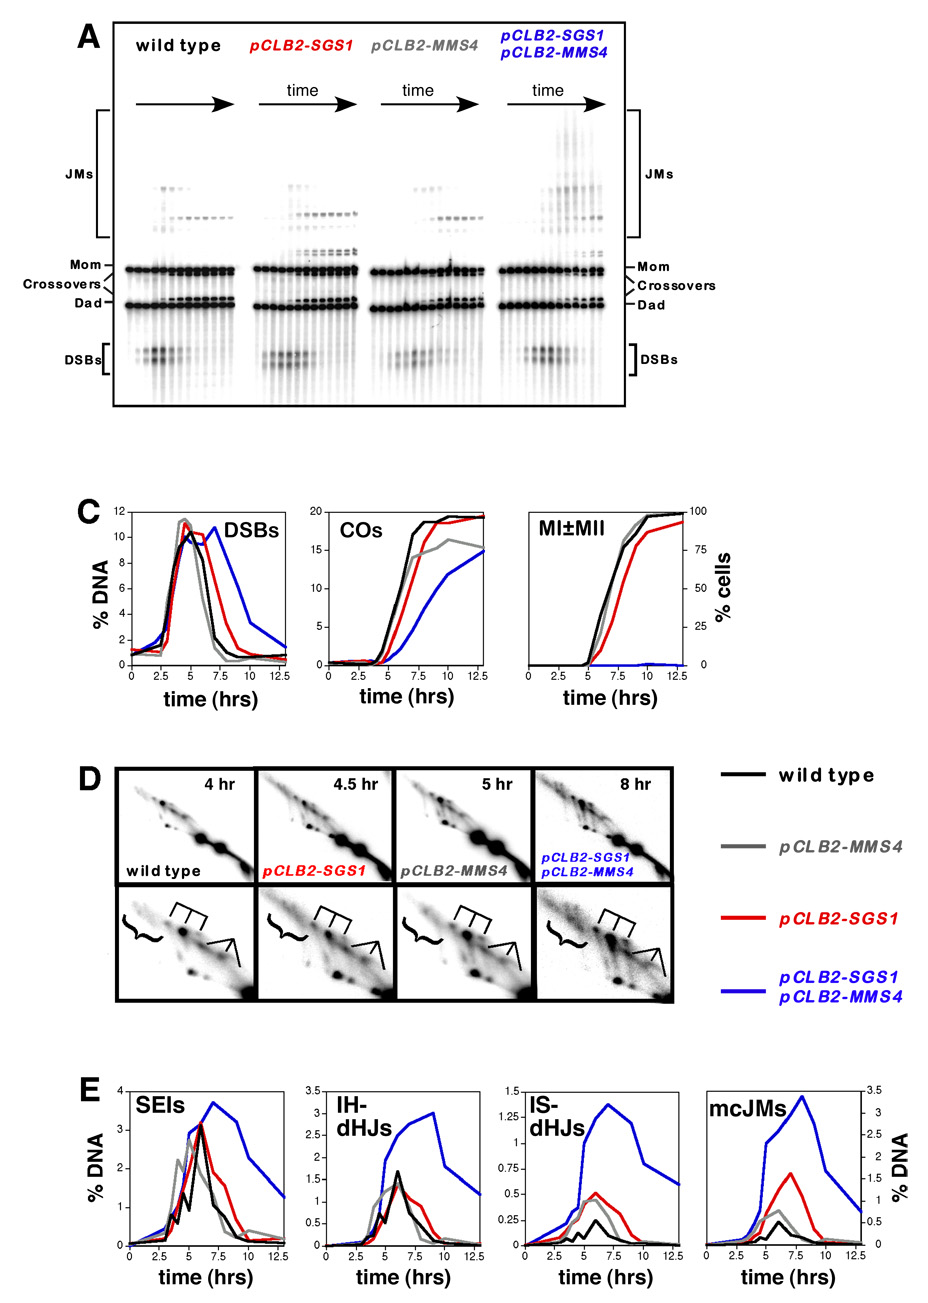
Figure 3. Physical Analysis of Recombination in Wild-Type, pCLB2-SGS1, pCLB2-MMS4 and pCLB2-SGS1 pCLB2-MMS4 Cells.
(A) Representative images of 1D Southern analysis.
(B) Quantitative analysis of DSBs, crossovers (COs) and meiotic divisions (MI±MII). “% DNA” is percent of total hybridizing DNA.
(C) 2D analysis of JMs. For each strain a representative 2D panel is shown together with a blowup of the JM region, below. dHJ species are highlighted by a trident; SEIs are indicated by a fork; mcJMs are indicated by a bracket.
(D) Quantitative analysis of JM formation.

