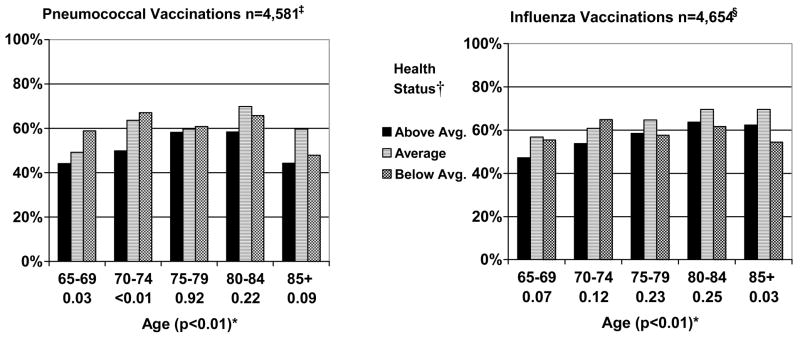
Figure 3.
Reported Receipt of Immunizations by Age and Health Status for Women aged 65 and Older (n=4,683). * †‡§
* Below each age category (65–69, 70–74, 75–79, 80–84, and 85+) is the P value for the test of trend for the influence of health on receipt of preventive health measures within each age group. In parenthesis next to age is the P value for the test of trend for the influence of age across all age groups.
† Perceived health, functional limitations, and a comorbidity count were used to classify women as either above average, average, or below average in health (page 7).
‡ Excluded 103 women who were missing whether or not they ever received a pneumonia vaccination.
§ Excluded 29 women who were missing whether or not they had a flu shot in the past year.

