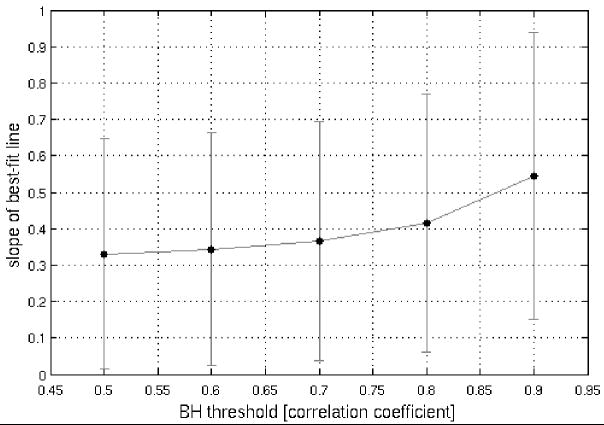
Figure 6.
Plots of regression-line slope versus correlation coefficient for the voxel-wise BH vs. SM comparison. (A) Over 26 regions (across 9 subjects; data from Table 2B), as the strength of voxel-wise BH and SM latency correlations increases, the slope of the corresponding regression line approaches 1. (B) Regression line slopes increase as a function of the threshold applied for selecting voxels in the BH task. The SM task threshold was held constant at r>0.6 so that a sufficient number of voxels were included in each comparison.


