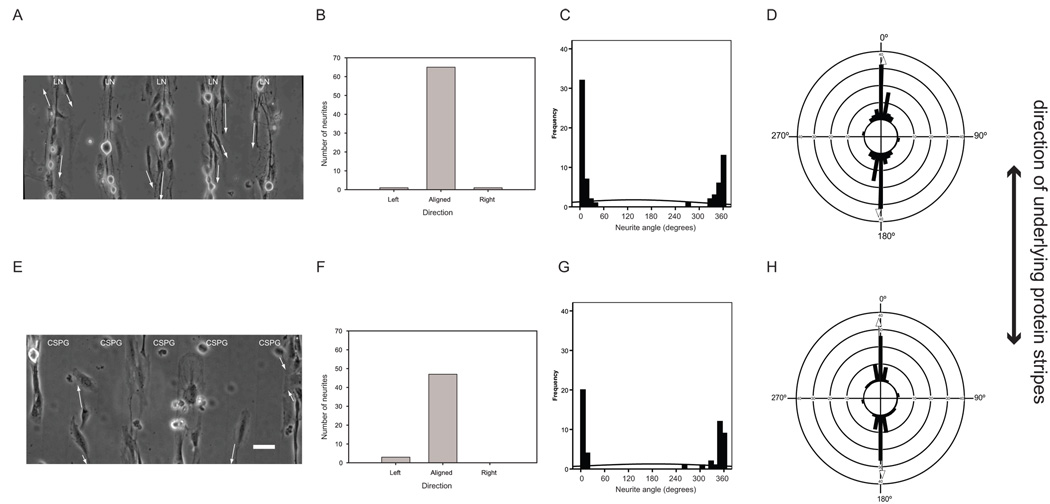
Figure 3. Distribution of neurites after 24 hours in culture on micropatterned LN or CSPG stripes shows clustered and directed neurite outgrowth angles.
Phase contrast images of DRG neurons on micropatterned LN (a) and CSPG (e) stripes respectively on glass surface. Bar = 50µm. Arrows show the vectors that were used to evaluate the neurites. (b, f) Bar graphs show the corresponding grouped neurite outgrowth angle data. (c, g) Linear histograms show corresponding distributions of neurite angles where each angle presented is the angle of the longest neurite per neuron. Normal curve is fitted to the linear histogram around the linear sample mean and standard deviation. Circular histograms show the corresponding distributions of neurite angles on LN (d) and CSPG (h) striped substrates, where each angle presented is the angle of the longest neurite per neuron. White arrows indicate mean neurite angles for directed distributions.

