
Figure 5. Increased adiposity in PPARδ −/− BMT mice.
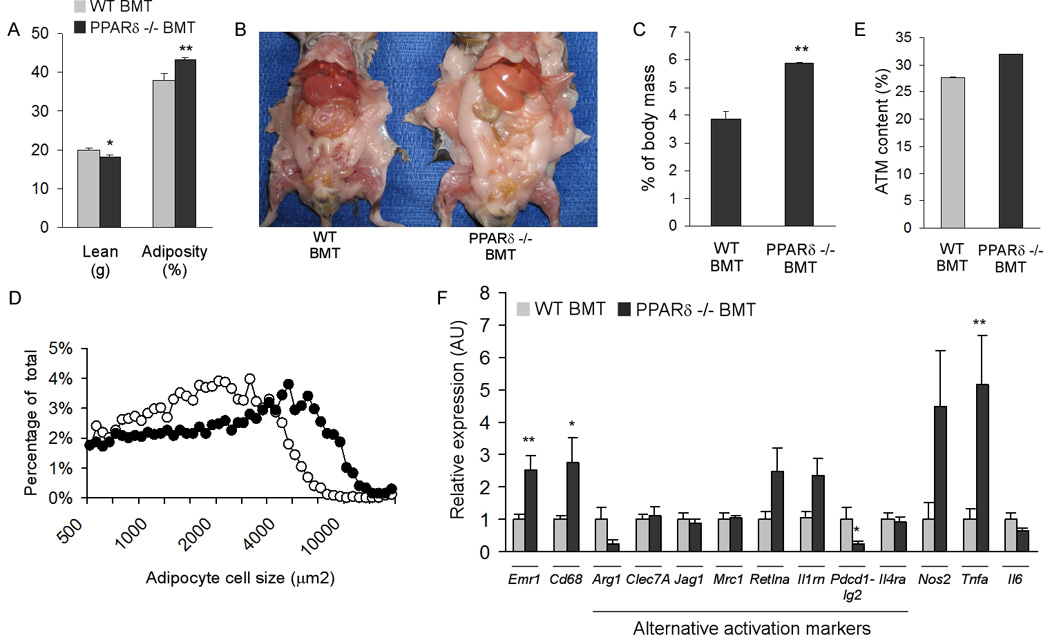
(A) Body composition was quantified by dual-energy X-ray absorptiometry in weight matched transplanted mice (n=7 per cohort). (B) Representative images of necropsied WT BMT and PPARδ null BMT mice after 22 weeks of high fat diet. (C) Increased epididymal fat pad mass in PPARδ null BMT mice (n=5 per cohort). (D) Increased adipocyte cell size in PPARδ null BMT mice. Adipocyte cell size was measured using dark field images. (E, F) Macrophage content and activation in white adipose tissue. ATM content was determined by immunostaining for the macrophage antigen F4/80, paired T-test P value = 0.16; n=4 per cohort (E). (F) Interrogation of ATM activation state by qRT-PCR. Emr1, F4/80; Cd68, macrosialin; Arg1, arginase I; Clec7A, dectin-1; Jag1, jagged 1; Mrc1, mannose receptor; Retlna, resistin-like alpha; Il1rn, IL-1 receptor antagonist; Pdcd1lg2, programmed cell death 1 ligand 2; Il4ra, IL-4 receptor alpha; Nos2, inducible nitric oxide synthase; Il6, interleukin-6; Tnfa, tumor necrosis factor alpha. Data presented as mean ± s.e.m. *P < 0.05, **P < 0.01.