Figure 3.

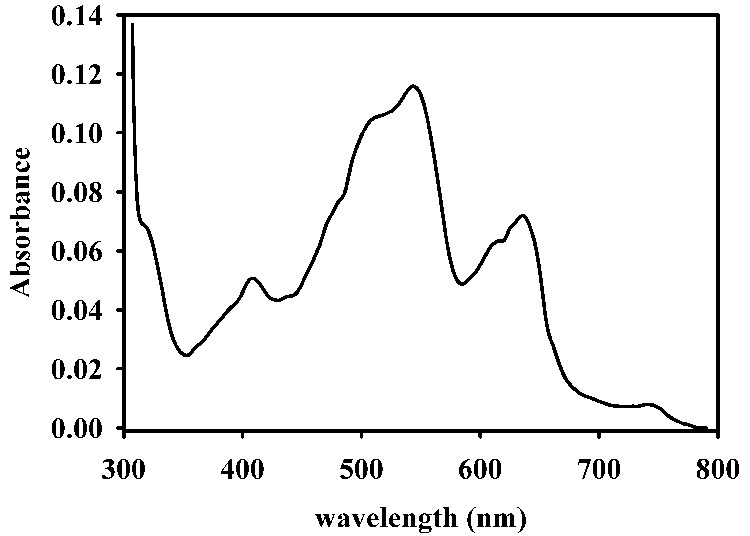
Fluorescence emission spectra of L1 samples. The concentration of L1 in the samples was 1 µM, and the buffer was 50 mM Hepes, pH 7.0. An excitation wavelength of 295 nm was used.

Fluorescence emission spectra of L1 samples. The concentration of L1 in the samples was 1 µM, and the buffer was 50 mM Hepes, pH 7.0. An excitation wavelength of 295 nm was used.