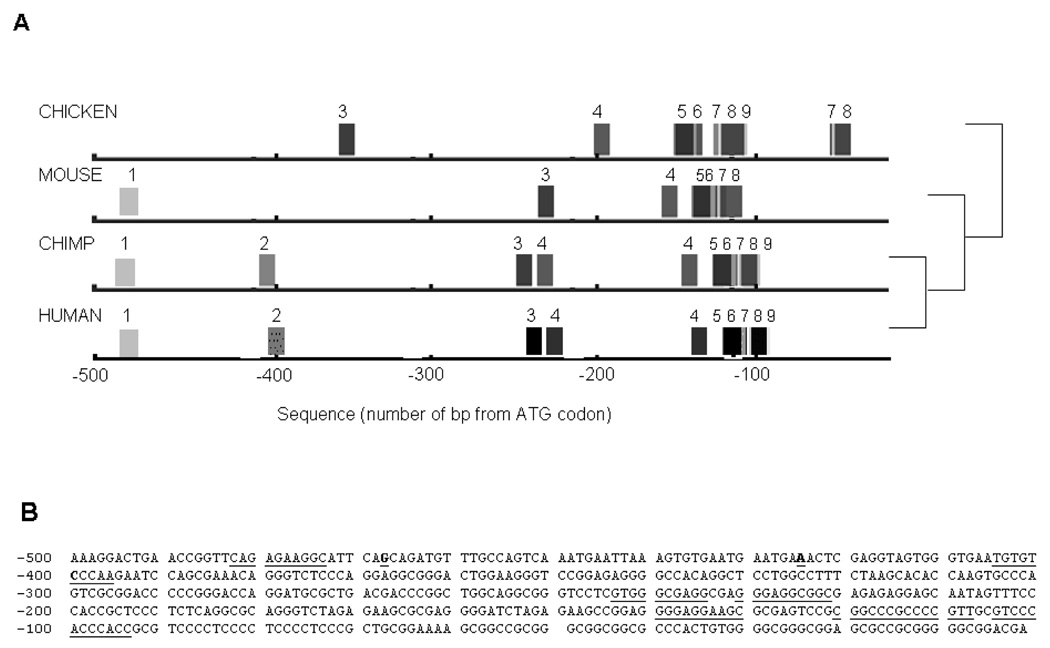
Figure 1. FootPrinter Analysis of Conserved Motifs in the 5’ Regions of the Human, Chimp, Mouse and Chicken ITGB3 Genes.
Five hundred base pairs of the 5’ region of the human, chimp, mouse and chicken ITGB3 genes underwent footprinting analysis to determine if there were any regions of conservation between the different species. Panel A: Identical motifs detected in each species’ sequence have the same number. The phylogenetic tree on the right hand side shows the evolutionary relationship between the different species. Panel B: Conserved motifs are underlined, several motifs between −90 and −140 overlapped. The positions of the −400C/A, −425A/C and −468G/A are in bold and underlined.

