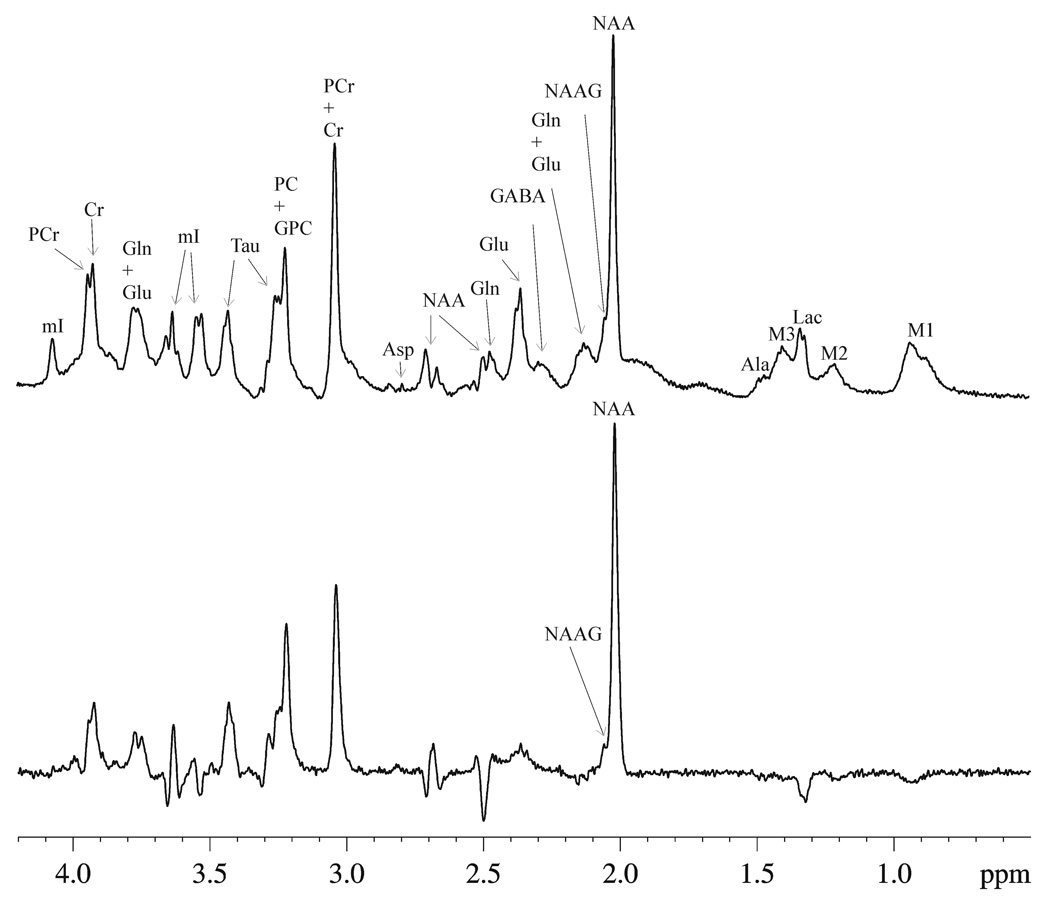
Fig. 2.
The localized (6 × 3 × 6 mm3) proton MRS spectra acquired from an individual rat brain with (a) short TE (TE = 15 ms, NA = 440, TR = 3.2 s, lb = −4 Hz, gb = 0.3) and (b) long TE (TE = 100 ms, NA = 1760, all other parameters were the same as in (a)). The spectra were phased using zero-order phase only without any baseline corrections, and were plotted using the same absolute intensity scale. Ala = alanine, Asp= aspartate, Cr = creatine, GABA = γ-aminobutyric acid, Gln = glutamine, Glu = glutamate, GPC = glycerophosphorylcholine, Lac = lactate, mI = myo-Inositol, NAA = N-acetylaspartate, NAAG = N-acetylaspartyglutamate, PC = phosphocholine, PCr = phosphocreatine, Tau = taurine, M1 = macromolecule at 0.92 ppm, M2 = macromolecule at 1.21 ppm, M3 = macromolecule at 1.39 ppm.

