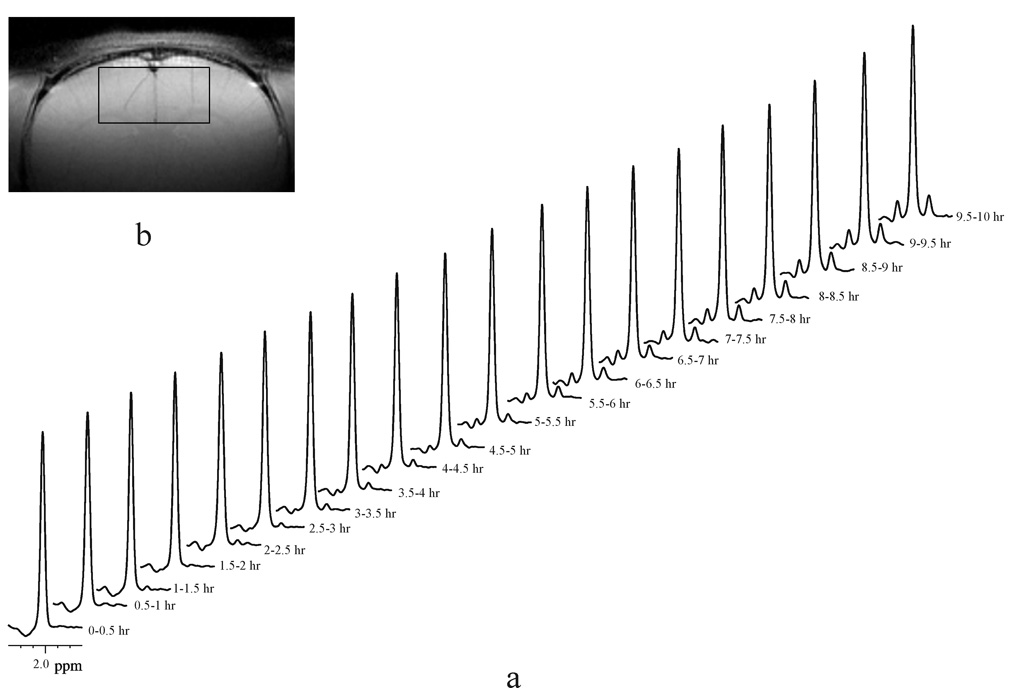
Fig. 3.
Detection of dynamic 13C-label incorporation into the N-acetyl methyl group of NAA (1JCH = 128 Hz) resonance using a proton-only MRS method at 11.7 Tesla. (a) Each spectrum (lb = −1 Hz, gb = 0.005) was an accumulation of 24 minutes (NA = 440) during a 10-hour [U-13C]glucose infusion. The stack of spectra were acquired from a 6 × 3 × 6 mm3 (108 µL) voxel in an individual rat brain. (b) The coronal image shows the location of the measured spectroscopic volume (slice thickness = 1 mm, field of view = 2.56 cm, matrix size = 256 × 256, TR/TE = 1000/10 ms, number of averages = 2).

