
Fig. 4.
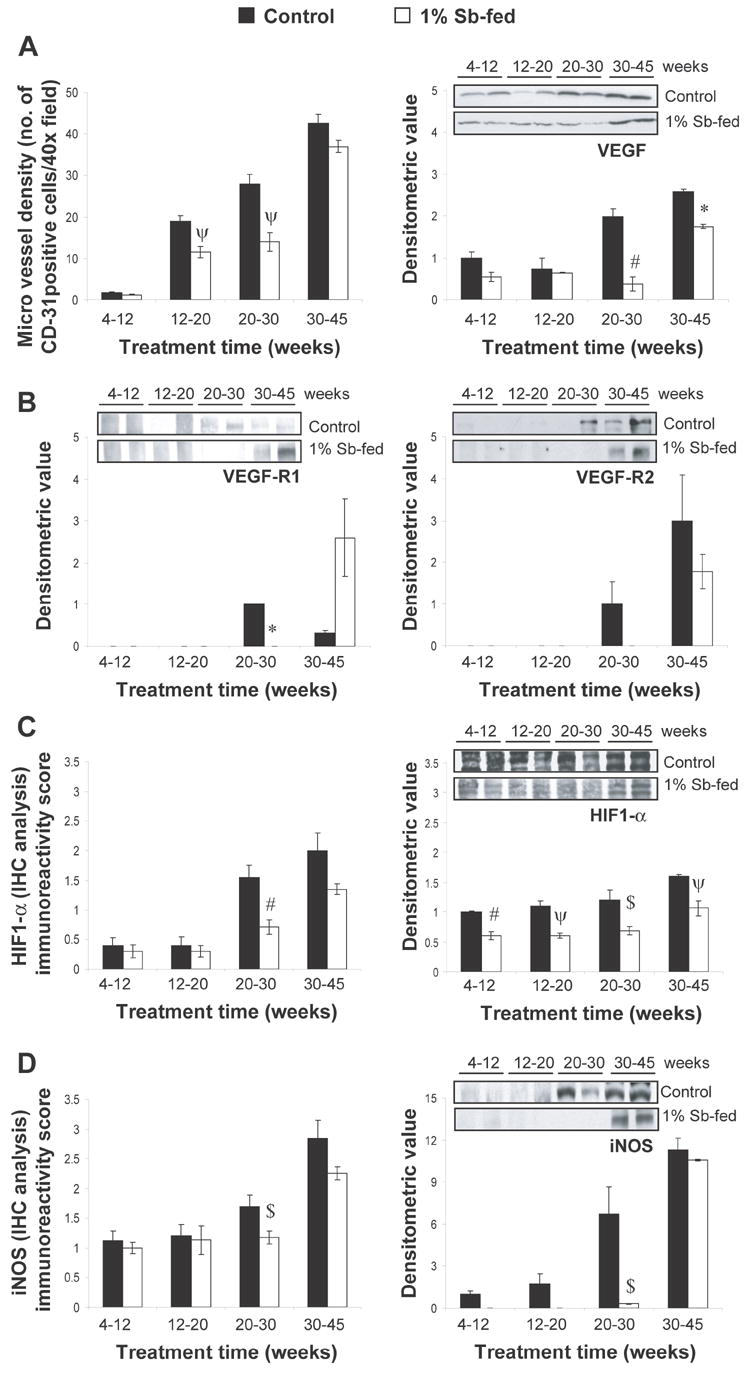
Stage specific effect of silibinin feeding on angiogenesis and pro-angiogenic markers in TRAMP prostate. (A, left) Effect of Silibinin feeding on intraductal MVD as inferred by IHC staining for the expression of PECAM-1/CD-31. IHC staining was based on DAB staining as detailed in “Materials and Methods”. Quantification of PECAM-1/CD-31-positive cells for determination of MVD is shown as mean and ± SEM (error bars) in each group. MVD was calculated as the number of positive cells × 100 / total number of cells counted under ×40 magnifications in 5 selected areas in each sample. (A, right) Stage specific effect of silibinin feeding on VEGF expression in TRAMP mice prostate as determined by WB analysis. (B) Stage specific effect of silibinin feeding on the expression levels of VEGF-R1 and VEGF-R2 in TRAMP mice prostate as determined by WB analysis. (C-D) Stage specific effect of silibinin feeding on the expression levels of HIF-1α and iNOS in TRAMP mice prostate as determined by IHC/WB analysis. Randomly, four prostate tissue samples from individual mice were selected from each group for WB analysis as detailed in “Materials and Methods”. Reactive protein bands were visualized by enhanced chemiluminescence detection system, and membrane were stripped and probed with β-actin as loading control. Densitometric analysis of band intensity for each protein was adjusted with β-actin (blots not shown). The results were reported as mean and ± SEM (error bars) of the four bands from individual mouse prostate in each group based on the relative densities compared to the 4-12 positive control group. Representative blots of two prostate samples from each group are shown. Difference between the positive control groups was determined by one-way ANOVA followed by Tukey-test for multiple comparisons, and values are mentioned only in the “Results section”. The difference between the positive controls versus the respective silibinin-fed group was analyzed by unpaired two-tailed Student’s t-test. P values <0.05 were considered significant. *, P<0.001; #, P<0.01; ψ P<0.02, $, P<0.05. Control, positive control (TRAMP mice); Sb, silibinin; MVD, microvessel density; platelet endothelial cell adhesion molecule-1 (PECAM-1/CD-31); VEGF, vascular endothelial growth factor; VEGF-R1, VEGF receptor-1; VEGF-R2, VEGF receptor-2; HIF-1α , hypoxia-inducible factor-1α; iNOS, inducible nitric oxide synthase; WB, western blot; IHC, immunohistochemical.