
Fig. 1.
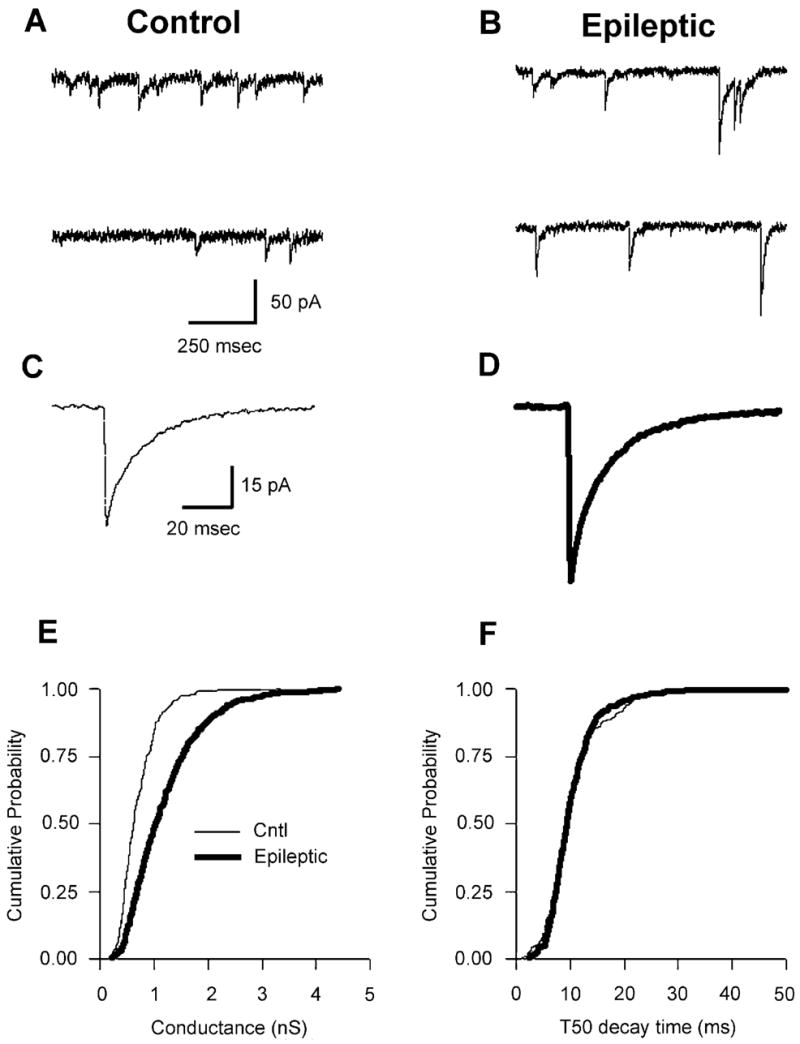
Comparison of mIPSCs in control and epileptic DGCs. (A and B) mIPSCs from (A) control and (B) epileptic DGCs. Data are continuous sweeps in control and epileptic neurons, respectively. (C and D) Averaged mIPSCs (from 50 random events) in the same cells as in A and B. Note larger average amplitude mIPSC in the epileptic neuron (D). (E) Cumulative probability–conductance plot demonstrating that mIPSCs recorded in epileptic DGCs (thick trace) were larger than those present in control DGCs. (F) Cumulative probability–50% decay time (T50) plot demonstrating that mIPSCs recorded in epileptic DGCs (thick trace) were identical to those recorded in control DGCs. However, the averaged weighted decay τ was significantly slower than averaged value in controls (see text). All data are from whole-cell patch-clamp recordings of DGCs in the presence of TTX (400 nM), CNQX (6 μM) and D-AP5 (50 μM). VHOLD = −60 mV in all experiments.