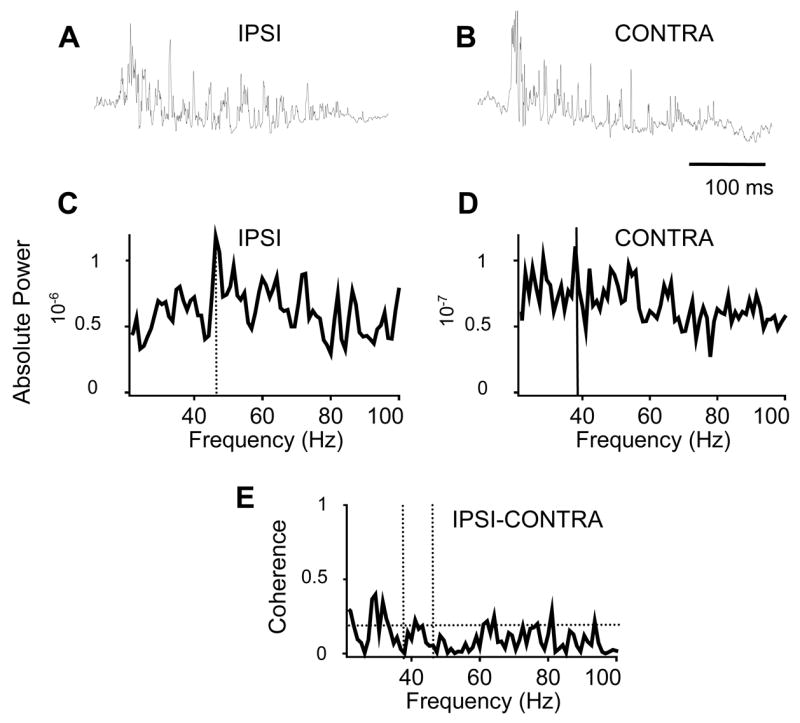
Figure 7.

Bilaterally recorded XII rootlet activity is weakly coherent. A and B. Representative raw filtered (1–200 Hz bandpass) inspiratory bursts recorded from the IPSI (A) and CONTRA (B) XII rootlet following unilateral excitation of the XII nucleus. C and D. IPSI and CONTRA average absolute power spectra each computed from 12 inspiratory bursts recorded following unilateral excitation of the XII nucleus. Dashed vertical lines mark the location of the dominant peaks in the IPSI and CONTRA power spectra at 46 and 38 Hz, respectively. E. Coherence plot computed from the IPSI and CONTRA average absolute power spectra in C and D. The dashed horizontal line marks the upper 95% confidence limit at 0.19. 46 and 38 Hz are marked by the dashed vertical lines. Although there are peaks in the IPSI (C) and CONTRA (D) average absolute power spectra at 46 and 38 Hz, respectively, the oscillations are not coherent at these frequencies. However, the small peaks that rise above the confidence limit between 22–100 Hz demonstrate that the left and right XII rootlet discharges are weakly coherent.
