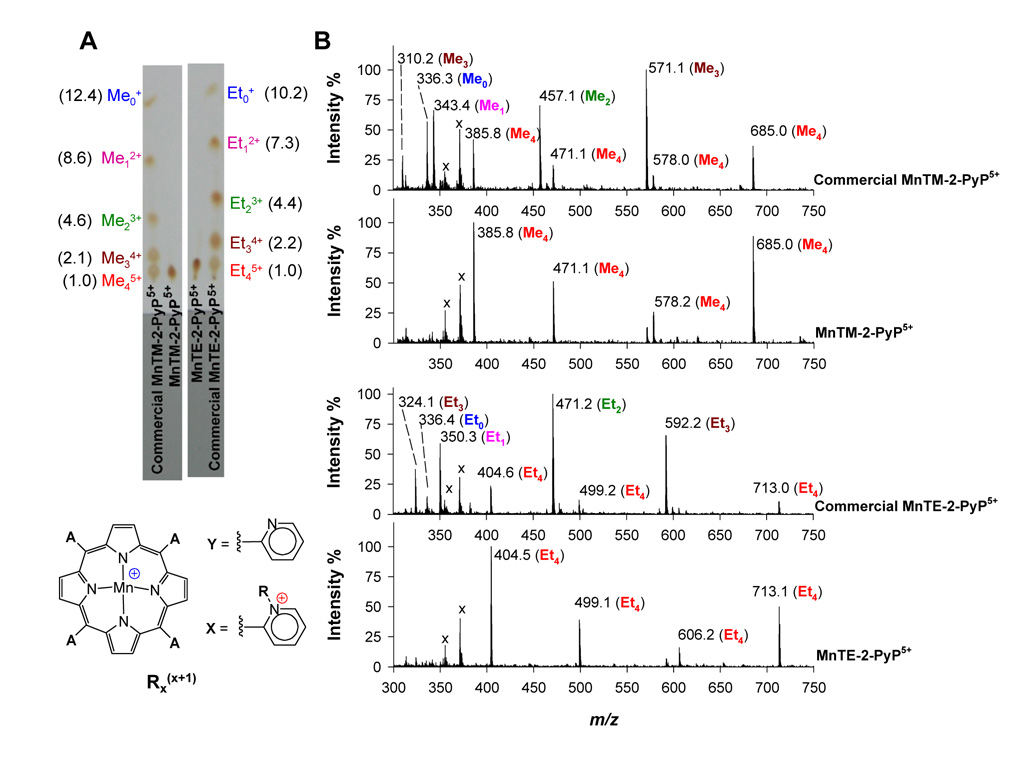
Figure 1.
TLC and ESI-MS analyses of authentic and commercial samples of MnTE-2-PyP5+ (R = Et) and MnTM-2-PyP5+ (R = Me). (A) TLC-SiO2 was eluted with a sat. KNO3(aq)-H2O-MeCN (1:1:8, v/v/v) mixture. The commercial samples are a mixture of compounds: R45+ (A = 4X), R34+ (A = 3X +Y), R23+ (A = 2X + 2Y), R12+ (A = X + 3Y), R01+ (A = 4Y). Rf values relative to R45+ are in parenthesis. (B) ESI-MS spectra were done in H2O-MeCN (1:1 v/v; containing 0.1% v/v HFBA). Peak assignments are given in Table 1. Peaks marked with “x” do not belong to the samples as they appear in the neat solvent spectra (baseline controls).

