
Figure 1.
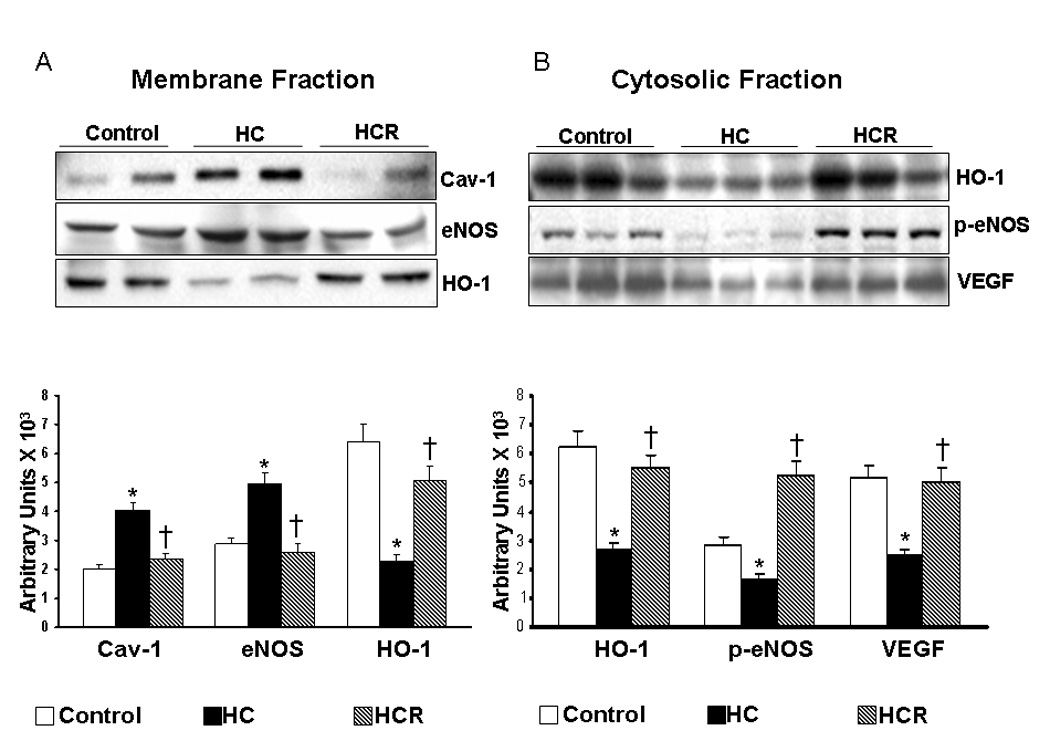
A) Representative Western blots showing the protein expression of Cav-1, eNOS and HO-1 in the membrane fraction. Graph represents the quantitative comparison between the groups. B) Representative Western blots showing the protein expression of HO-1, p-eNOS and VEGF in the cytosolic fraction. Graph represents the quantitative comparison between the groups. *p<0.05 represent HC compared with control, †p<0.05 HCR compared with HC. Where HC represents high cholesterol diet fed rats, HCR represents HC rats treated with resveratrol.