
Figure 3.
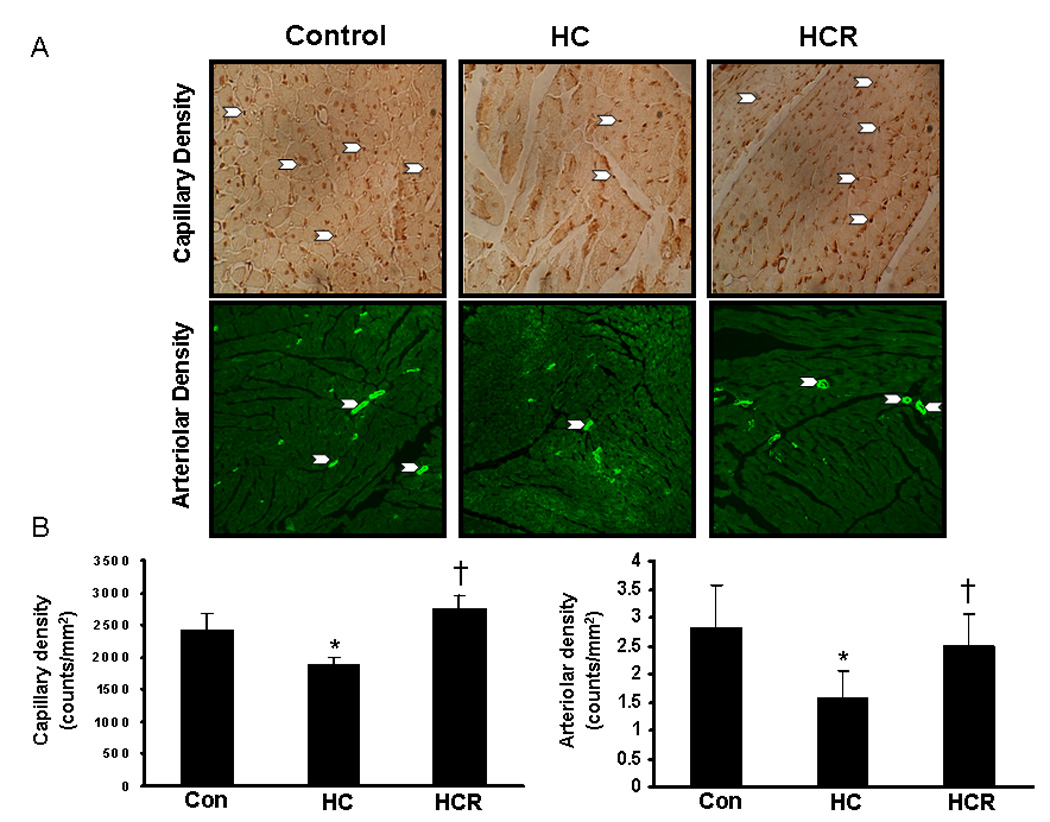
A)_Figures represent the capillary density and arteriolar density between the comparative groups in the peri-infarct area 4 and 30 days after myocardial infarction respectively. B) Graphs represent the quantitative analysis of capillary and arteriolar density between the comparative groups. *p<0.05 represent HC compared with control, †p<0.05 HCR compared with HC. Where HC represents high cholesterol diet fed rats, HCR represents HC rats treated with resveratrol.