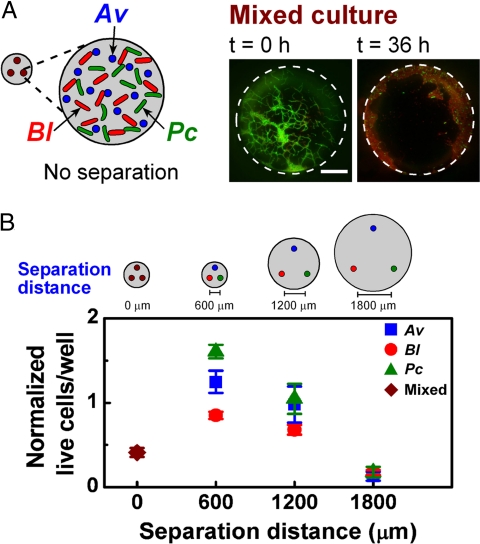
Fig. 3.
Synthetic community coexists only at intermediate separations. (A) A schematic drawing (Left) of a mixed culture of all three species in each well of the microfluidic device and representative fluorescent images (Right) of a culture well containing all three species over time. Bacteria were stained to indicate live (green) and dead (red) cells. Scale bar represents 50 μm. (B) Graph comparing the normalized number of live cells of each species in devices with culture wells separated by four different distances. In the 0-μm separation distance, total numbers of all three species were counted. Error bars represent standard errors.

