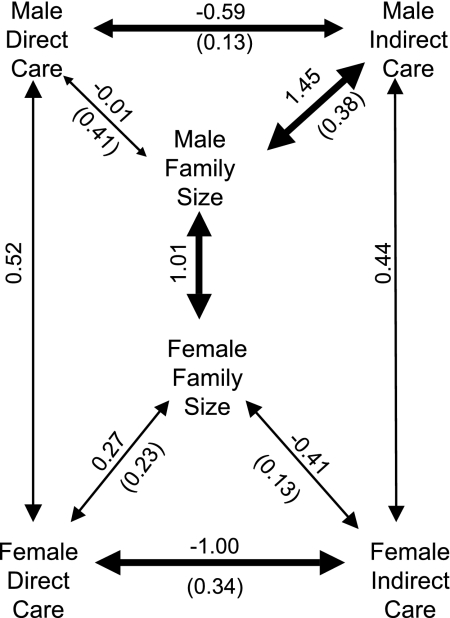
Fig. 4.
Genetic architecture underlying parental care behavior in males and females. Arrows between the same behaviors expressed in the different sexes indicate intersexual genetic correlations, whereas arrows between different behaviors within a sex indicate intrasexual genetic correlations. The width of the arrows reflects the strength of the genetic correlation, the estimated value is given above the arrows, and a jackknifed standard error (40) is presented in parentheses below the arrow.

