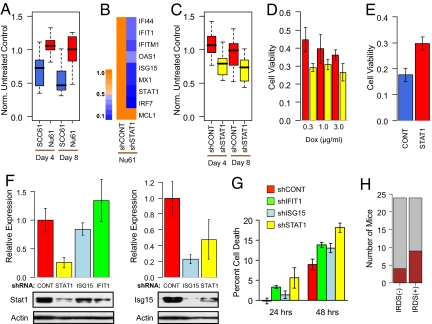
Fig. 2.
IRDS genes influence resistance to chemotherapy. (A) The IRDS(−) SCC61 (blue) and IRDS(+) Nu61 (red) cell lines were xenografted into the flank of nude mice and tumor volume measured after treatment with doxorubicin. Shown is a box-and-whisker plot (P < 0.001 for each time point by Wilcoxon rank-sum test, n = 9–10 for each group). Measurements are expressed relative to untreated controls. (B) STAT1 expression was inhibited in Nu61 using stable shRNA, and resulting expression levels of IRDS genes is indicated by the heat map and legend (showing proportional reduction in gene expression). (C) Nu61 with shRNA to STAT1 (yellow) or a control shRNA (red) were xenografted into mice and treated with doxorubicin as described in A (P < 0.001 for day 4 and P = 0.008 for day 8 by Wilcoxon rank-sum test, n = 14–15 in each group), or (D) treated with the indicated doses of doxorubicin in vitro. Shown is viability by MTS assay at 72 h relative to non-treated control (P < 0.05 for all doses by t test, n = 6 in each group). (E) STAT1 was constitutively over-expressed (47-fold by quantitative RT-PCR) in the SKBR3 human breast cancer cell line (red), and viability after doxorubicin was compared with a vector control (blue, P = 0.004 by t test, n = 3 in each group). (F) Expression of either STAT1 (Left) or ISG15 (Right) was determined by immunoblotting of Nu61 stably expressing a shRNA vector for STAT1 (yellow), ISG15 (light blue), IFIT1 (green), or a non-silencing control (red). Graphs show quantitation of protein levels relative to the control after normalization to actin (mean ± SEM, n = 3–4). A representative blot is shown below each graph. (G) The indicated Nu61 shRNA cell lines were treated with doxorubicin, and percent cell death was measured by subG1 content (mean ± SD, n = 3). (H) The SCC61 cell line (IRDS(−)) and Nu61 cell line (IRDS(+)) were assayed for lung metastasis. Shown is a stacked bar plot of the number of mice with gross lesions (brown) and no lesions (gray) between the two groups (P = 0.19 by Fisher's test).

