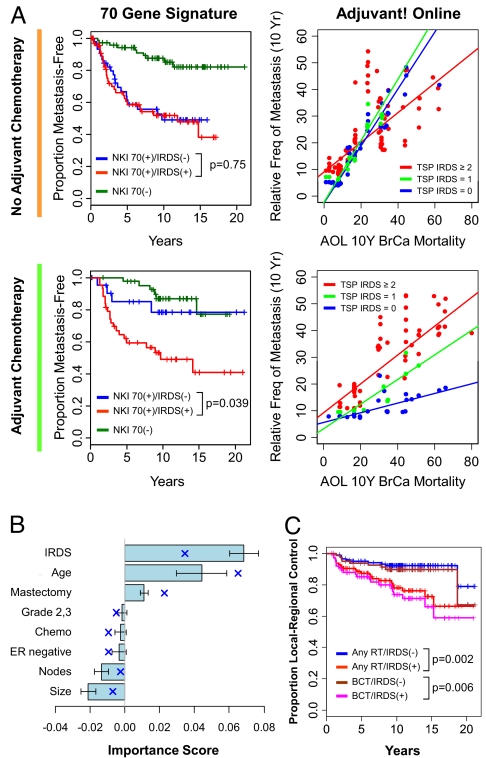
Fig. 5.
The IRDS predicts sensitivity to ADCT among patients at risk for metastasis and predicts local-regional failure after adjuvant RT. (A) Each of the 185 patients who did not receive ADCT (grouped beside the orange line) or the 110 patients who received ADCT (grouped beside the green line) were classified using the NKI 70 gene signature as having a good prognosis [NKI 70(−)] or a poor prognosis [NKI 70(+)]. NKI 70(+) patients were further split by IRDS status. TSP IRDS scores of <2 and ≥2 were used to define IRDS(−) and IRDS(+), respectively. Shown on the left are the metastasis-free survival curves. The log-rank P values compare the groups stratified by IRDS. Adjuvant! Online (AOL) mortality score and the TSP IRDS were used in an RSF model. Shown on the right are the predicted 10-year relative frequency of metastasis as a function of AOL score. IRDS(+) patients are in red, patients with a TSP IRDS of 1 are in green, and patients with a TSP IRDS of 0 are in blue. Regression lines through these points are displayed. The prediction errors of the RSF model are 37.9% for no ADCT and 39.2% for ADCT. (B) The 243 patients who received adjuvant RT were analyzed using RSF for local-regional control (LRC). The importance scores from an RSF model for the indicated covariates are shown (mean ± SD) and the mean importance scores from Cox regression are superimposed (blue cross). The error rate for the full RSF model is 38.7% and for the Cox model is 30.8%. (C) Shown is LRC stratified by IRDS status for the patients receiving adjuvant RT after breast conservation or mastectomy (any RT), or the 161 patients receiving RT after breast conservation therapy only.

