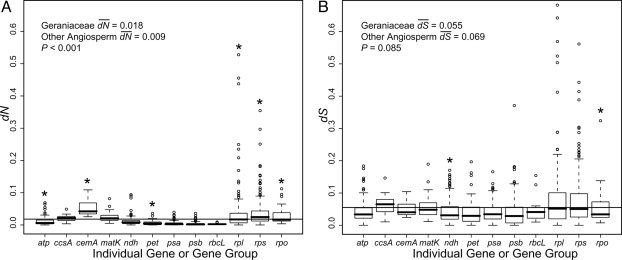
Fig. 2.
Boxplots of the number of (A) nonsynonymous (dN) and (B) synonymous (dS) substitutions for individual Geraniaceae genes or groups of genes (see Materials and Methods). Wilcoxon rank sum tests were used to show that values for Geraniaceae dN were significantly higher than for other angiosperms (P < 0.001), whereas values of dS were not significantly different (P = 0.085). The horizontal line is the mean value of dN or dS in Geraniaceae. For each gene group, the box represents values between quartiles, dotted lines extend to minimum and maximum values, outliers are shown as circles, and the thick, black lines show median values. Asterisks show values for gene groups that are statistically different (P < 0.05 after Bonferroni correction; data not shown) than the values for same gene group in other angiosperms. See Tables S4 and S5 for post hoc statistics.

