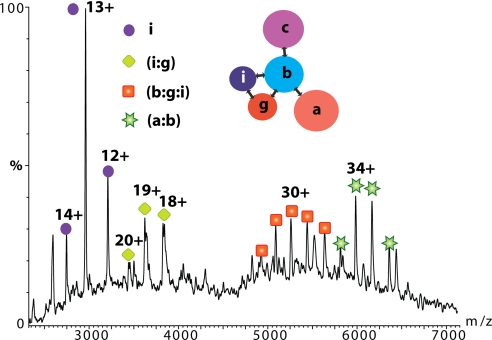
Fig. 3.
MS spectrum of the yeast eIF3 isolated by tagging subunit eIF3b. Charge state series are assigned on the basis of masses to subcomplexes eIF3i:g, eIF3b:g:i, and eIF3a:b. eIF3i is observed dissociating from the yeast complex at ≈m/z 3,000. (Inset) The interaction network for yeast eIF3 derived from seven subcomplexes observed by MS.

