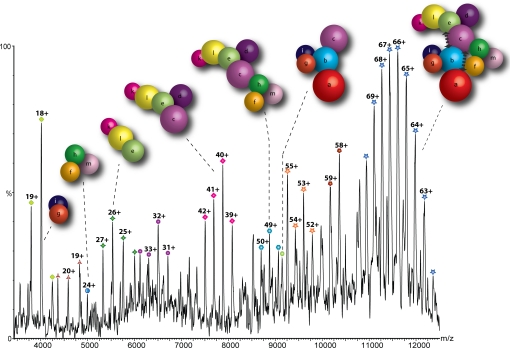
Fig. 4.
Model of the human eIF3 derived from 27 subcomplexes, IP data, and interactions identified in the yeast complex. The complex dissociates into distinct modules in response to changes in ionic strength; in this case, the spectrum shown was recorded at intermediate ionic strength (350 mM AmAc). Arrows denote additional interactions not readily represented in this model.

