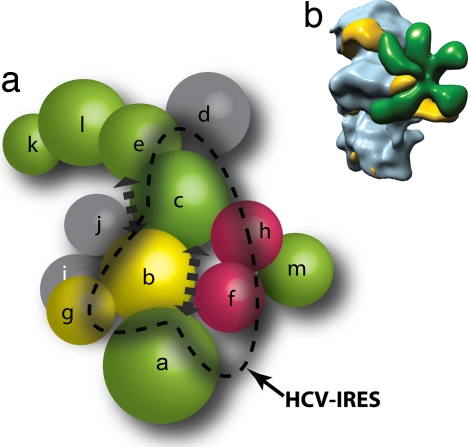
Fig. 5.
Proposed model for the eIF3:HCV IRES interaction. (a) Subunit organization colored according to signature domains contained within the various subunits. PCI-containing domains (green), MPN domains (red), and RNA recognition motifs (yellow) show direct interactions with the exception of eIF3m and eIF3a. Subunits with no common signature domains are shown in gray. Subunits that are affected by binding of HCV IRES are within the dashed line. The location of subunits satisfies the interaction network and is not indicative of their location within the EM density. (b) EM model of eIF3-IRES-40S complex showing the binding of IRES (yellow) to both eIF3 (green) and the 40S (blue).

