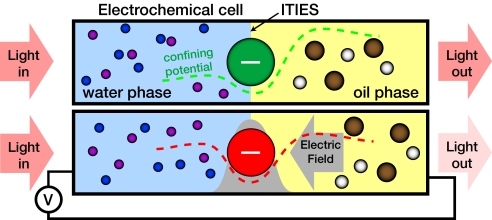
Fig. 1.
Schematic view of ITIES with negatively charged nanoparticle adsorbed at the interface, with and without applied electric field. Nanoparticle color indicates peak optical absorption, which is changed by the electric field. Positive and negative ions are shown as small spheres: violet and blue (in water) and brown and white (in oil). The gray arrow indicates the electric field direction, and the gray filled region indicates the field strength. The electric field pushes the negatively charged nanoparticle toward the oil phase, and a dashed line sketches the total potential that confines the nanoparticles to the interface (8).

