
Figure 5.
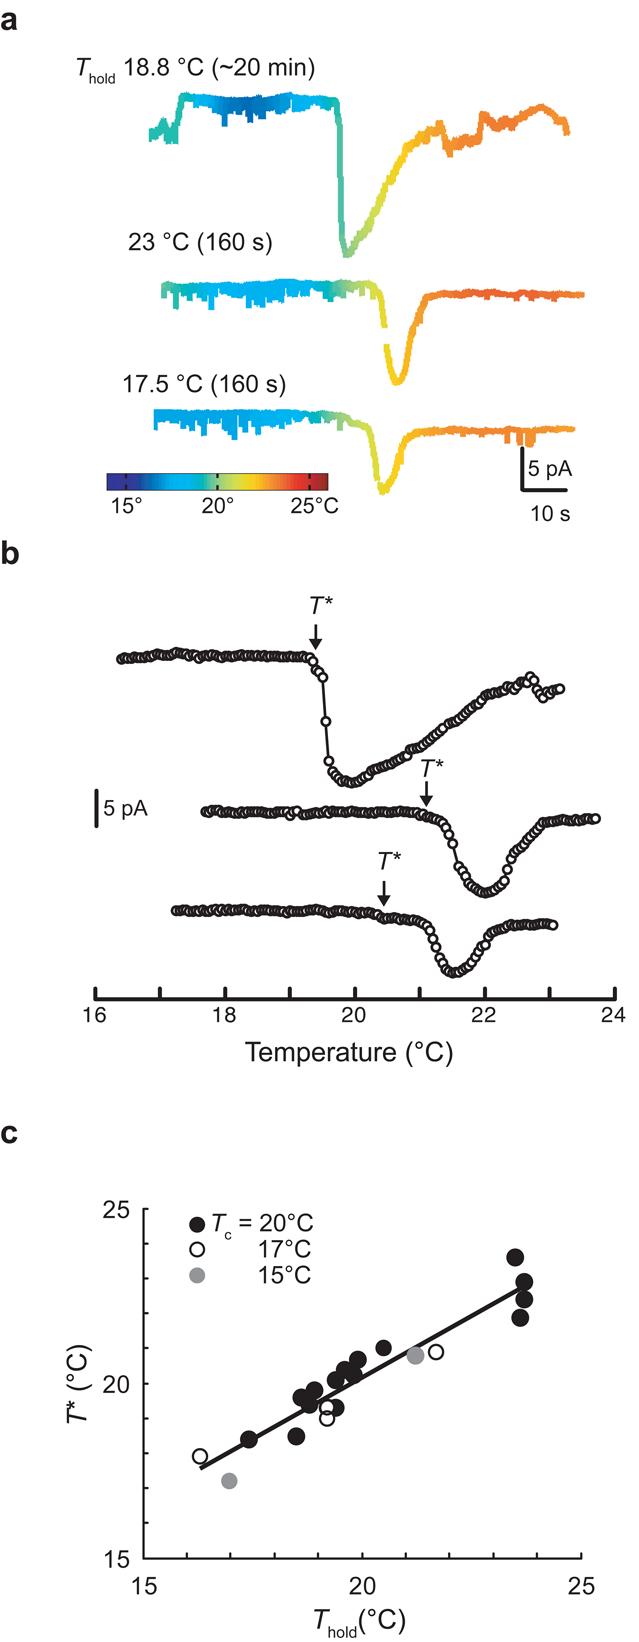
ThRC adaptation. (a) ThRCs elicited by three consecutive thermal ramps applied to a single AFD neuron. Between stimulus ramps, Thold was held at the value indicated for the duration given in parentheses. (b) Warming-evoked ThRCs plotted against temperature (same recording as in a). Open circles are average current in 0.05°C intervals. (c) T* plotted against Thold for AFD recordings obtained from animals cultivated at 15 (n = 2), 17 (n = 4) and 20°C (n = 15). Points represent T* measured from the first stimulus ramp applied in each individual recording. The line is a least-squares fit to the data (R2 = 0.91).