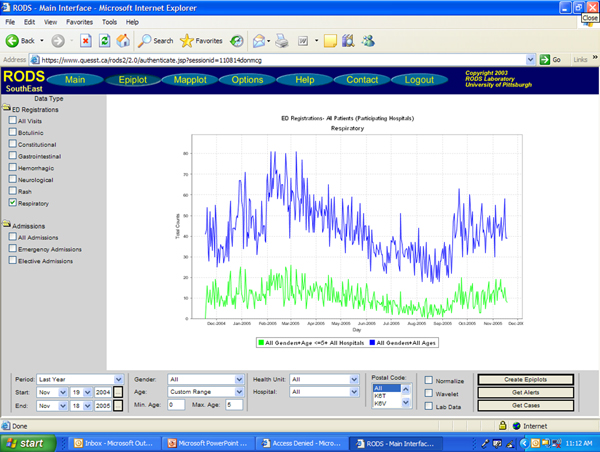
Figure 3.

RODS Epiplot Function of Sample Data – Total Syndromic Counts vs. Age-restricted Subgroup. Figure 3 shows another example of an Epiplot of the same sample influenza data. The blue line shows respiratory syndromic counts from emergency departments of participating hospitals; the green line indicates those counts from a subset of age-restricted data (in this case <=5 years of age).
