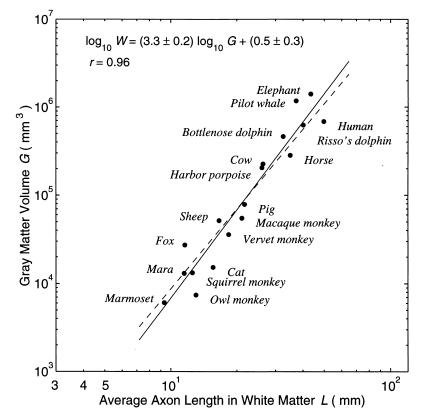
Figure 3.
Testing the cubic postulate between the gray matter volume and the average length of fibers in white matter, which was inferred from Eq. 13 assuming p = 0.08. The theoretical slope of 3 (dashed line) is reasonably close to the slope of 3.3 estimated by least squares as shown, or the slope of 3.2 estimated by robust estimation with absolute deviations (not shown). Data were taken from table 1 in ref. 11, where cortical surface area and thickness are related rigorously by Eq. 1.

