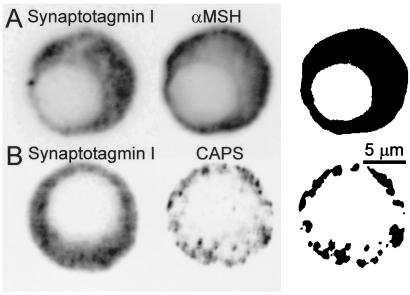
Figure 2.
Subcellular distribution of synaptotagmin I, α-MSH, and CAPS in rat melanotrophs. Double immunofluorescence confocal micrographs obtained with mouse antisynaptotagmin I antibodies (Left) and rabbit anti-α-MSH antibodies (A, Center) or anti-CAPS antibodies (B, Center). Immunoreactivity was detected with CY3-conjugated anti-rabbit and fluorescein-conjugated anti-mouse antibodies. Optical sections were taken through the center of the nucleus. Cell diameter is around 12 μm. (Right) The images show the masks obtained after selection of the pixels double-labeled with CY3 and fluorescein from the two-dimensional scatter histograms of gray values. The colocalization of two images in B (Right) indicates that synaptotagmin I and CAPS are colocalized to a subset of vesicles. Fluorescence intensity was inversed as in Fig. 1.

