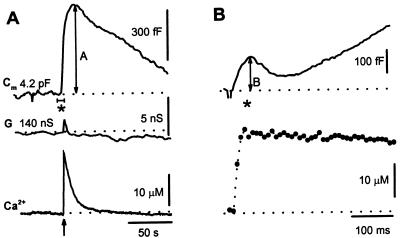
Figure 3.
(A) Time-dependent changes in flash-induced changes in Cm at low time resolution. A flash application (arrow) elicited a transient in [Ca2+]i (Bottom). Dashed line represents resting Cm of 4.2 pF [resting Cm was 5.3 ± 0.2 pF (mean ± SEM, n = 50)]. The maximum amplitude of the Ca2+-induced rise in Cm (slow exocytosis) is indicated by A. G shows conductance, which reflects changes in access conductance, membrane conductance, and Cm. Access conductance (140 nS, dashed line) was determined with controls on the SWAM amplifier. (B) Expanded high time resolution of Cm trace from A, labeled by *. Changes in Cm after a flash (arrow)-induced increase in [Ca2+]i (Lower) and Cm (Upper). B indicates the amplitude of the early rapid Cm response.

