Figure 4.
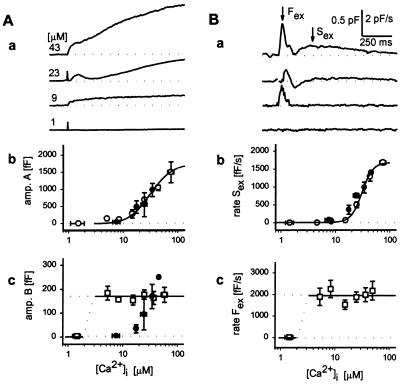
Ca2+ dependence of rapid and slow kinetic components of Cm. (A) (a) Four examples of flash-induced Cm traces recorded at different peak [Ca2+]i (indicated at the beginning of each trace). Artefacts denote flash delivery. Relationship between the peak [Ca2+]i and the amplitude of slow component (b) is depicted by ○, whereas the amplitude of the rapid component of exocytosis (c) is shown by □. Each point represents 3–25 averaged measurements. Error bars indicate SEM. Curve fitted through points in b is of the form: Cm = (1,753[Ca2+]2)/(Kd2 + [Ca2+]2), where Cm is in fF and Kd (30.2 μM) represents the [Ca2+] at which the response in Cm is half-maximal. Amplitude B was not correlated to [Ca2+]i, the line represents the mean amplitude of the rapid exocytosis (167 fF). Filled symbols show the effect of CAPS antibody injection on measured parameters. (B) (a) Time derivatives of traces shown in Aa. Two maxima are indicated by arrows (Fex and Sex denoting rapid and slow exocytosis). Relationship between peak [Ca2+]i and Sex is shown in b (○) and Fex in c (□). Each point represents 4–28 averaged measurements. Error bars indicate SEM. The curve drawn through points in b represents a best fit obtained by the sigmaplot nonlinear regression algorithm and is of the form: dCm/dt = (A[Ca2+]n)/(Kdn + [Ca2+]n), where A = 1,678 ± 125 fF/s, n = 4.3 ± 0.7; Kd = 30.7 ± 1.7 μM; all parameters are in the format mean ± SEM, P < 0.0001. Data points larger than 5 μM [Ca2+] in c showed no apparent dependence of dCm/dt and [Ca2+], the line drawn equals the average value of 1,916 fF/s. Filled symbols show the effect of CAPS antibody injection on maximal dCm/dt, b). Note that in these experiments responses are characterized by only one maximum in dCm/dt (see Fig. 5A).

