Figure 5.
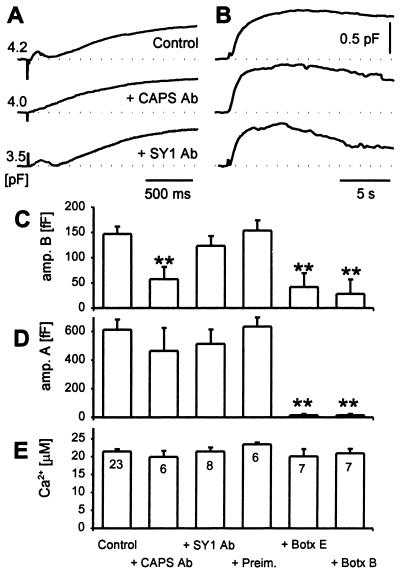
Rapid component of Cm increase is blocked by CAPS antibody. Three examples of time-dependent changes in Cm induced by caged photolysis of NP-EGTA (artefacts) in a control cell, in a cell preinjected with anti-CAPS serum (+CAPS Ab), and in a cell preinjected by an antisynaptotagmin I/II antibody (31) (SY1 Ab). Responses in Cm to 21, 21, and 20 μM peak [Ca2+] transients (control, CAPS Ab, and SY1 Ab, respectively) are shown at high (A) and slow (B) time resolution. A shows early responses where the amplitudes for rapid exocytosis is easily noticed in control and SY1 Ab-treated cells, whereas in B 25s epochs are shown to highlight the slow exocytosis. (C) Mean amplitude of the rapid kinetic component (amp. B) and (D) mean amplitude of the slow kinetic component (amp. A) of the biphasic secretory response elicited by a transient increase in [Ca2+]i by UV flash photolysis in control cells, cells preinjected with CAPS Ab (+CAPS Ab), SY1 Ab (+SY1 Ab), protein A-Sepharose purified Ig fractions from sera of nonimmunized animals (+Preim.), and botulinum neurotoxins B (+Botx B) and E (+Botx E). (E) Average peak response in [Ca2+]i elicited by UV flash photolysis of Ca2+-loaded NP-EGTA. Numbers adjacent to columns in E indicate numbers of cells studied. Error bars indicate SEM, and * indicate significant differences compared with the control (**, P < 0.01, Student's t test).

