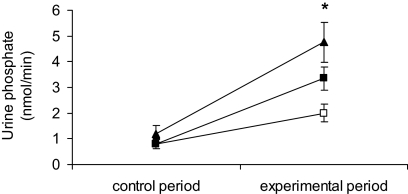
Figure 3.
Urinary phosphate excretion in rats infused with HEPES (□) or 1 mg/kg per h MEPE (▪) or 3 mg/kg per h MEPE (▴). Data are means ± SEM; n = 6. Comparison between the changes in phosphate excretion in the MEPE-treated groups with that in the vehicle group was made using an ANOVA with post hoc comparisons performed using the Bonferroni multiple comparisons test. *P < 0.05.

