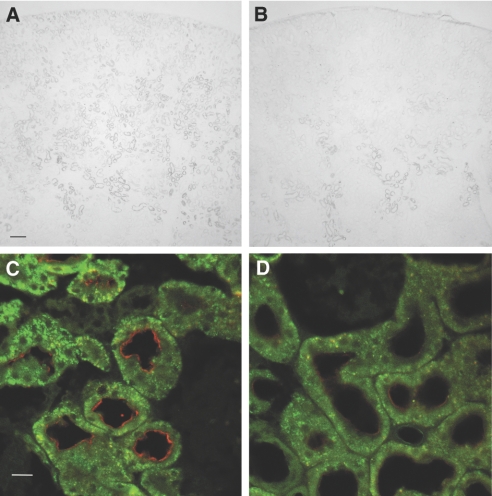
Figure 5.
(A through D) Immunohistochemistry of NaPi-IIa in the kidneys of HEPES-infused (A and C) and 3 mg/kg per h MEPE–infused (B and D) rats. (A and B) Cortical NaPi-IIa localization using 3,3′-diaminobenzidine tetrahydrochloride staining and light microscopy. Bar = 200 μm. (C and D) Protein levels at the BBM of proximal tubules using Texas red staining and confocal imaging. Bar = 20 μm.

