Figure 1.
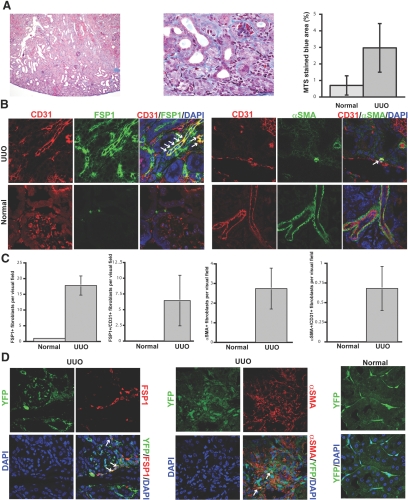
EndMT in the mouse model of UUO. (A) Kidneys were analyzed after 1 wk of ureter ligation. The pictures display representative photomicrographs of MTS-stained kidney section at an original magnification of ×10 (left) and ×60 (middle). Fibrosis was digitally quantified and is shown as the percentage of MTS-stained blue area in both normal and UUO kidneys (right). (B, left) FSP1 and CD31 double labeling. Frozen kidney sections were double stained with antibodies to FSP1 (green) and CD31 (red). DAPI was used as a nuclear stain (blue). The panels display representative images that were obtained from UUO kidneys (top) and normal kidneys (bottom) using a confocal microscope. The arrows in the merged panel point to CD31+FSP1+ cells. (B, right) α-SMA and CD31 double labeling. The pictures display representative pictures of kidneys that were labeled with antibodies to α-SMA (green) and CD31 (red). DAPI was used for labeling of nuclei (blue). Yellow color in the merged panel indicates coexpression of α-SMA and CD31. The photomicrographs were obtained by confocal microscopy. (C) Quantification of fibroblasts. The bar graphs summarize average numbers of FSP1+ fibroblasts, CD31+FSP1+ cells, α-SMA+ fibroblasts, and CD31+α-SMA+ cells per visual field in both normal and obstructed kidneys at a magnification of ×63 (n = 3 mice per group, 10 high-power fields [hpf] per mouse, 30 hpf total). (D) Lineage tracing of endothelial cells. UUO was performed in Tie2-Cre;R26R-stop-EYFP double-transgenic mice. In this reporter strain, all cells of endothelial origin are tagged by YFP (shown in green). After UUO, immunostaining was performed for FSP1 (left, red) or α-SMA (middle, red). White arrows indicate fibroblasts of endothelial origin (yellow). For comparison, a representative YFP image from a normal Tie2-Cre;R26R-stop-EYFP kidney is also included (right). Magnification, ×63 in B and D.

