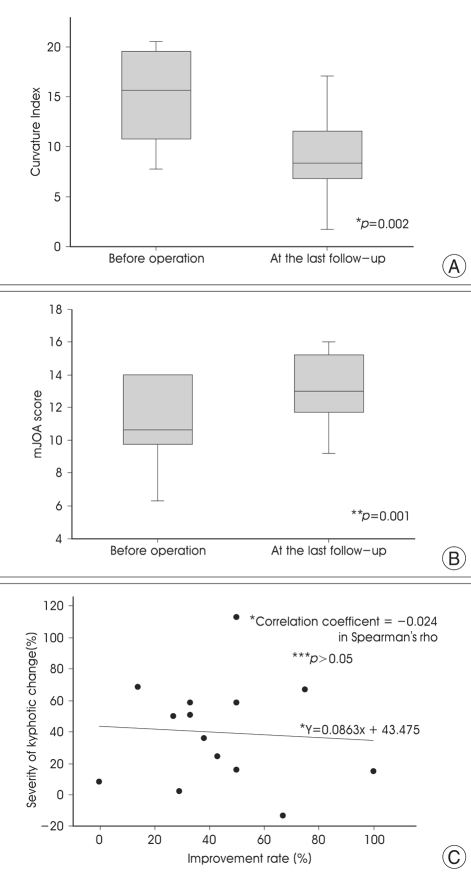
Fig. 3.
Box graph and scatter diagram. The error bars and three lines in the vertical box in the box graph represent the cut-off values for the 90th, 75th, median, 25th, and 10th percentiles. A : Comparison of pre- and postoperative curvature of the cervical spine using the Curvature Index (CI). The decrease in CI is indicative of a significant postoperative kyphotic change (*p=0.002). B : Comparison of pre- and postoperative neurological status as assessed by modified Japanese Orthopedic Association (mJOA) score shows a significant postoperative neurological improvement (**p=0.001). C : There was no significant correlation between the degree of kyphotic change and rate of improvement (***p>0.05, *correlation coefficient: -0.024 in Spearman's rho, -0.056 in Kendall's tau-b).

