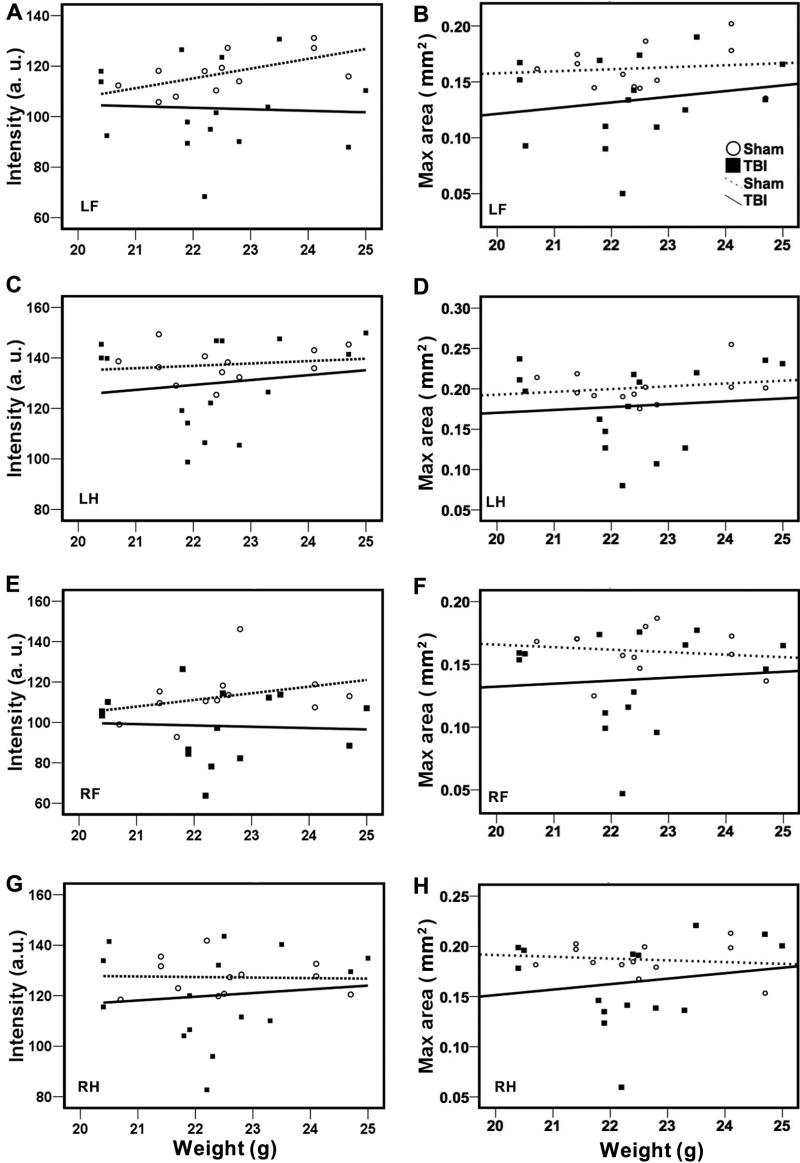
Figure 6.
Lack of correlation between body weight and intensity (A, C, E, &G) or max area (B, D, F, &H) in either sham or TBI mice at 3 days after CCI. Variation in intensity or max contact area with body weight in sham (open circles) and TBI mice (filled squares) is shown in the plot. Linear regression lines were plotted in each treatment group (dotted lines for sham and solid lines for TBI). There was no relationship between body weight and intensity or max area.

