
Figure 1. Time course of phospho p38, phospho Erk1/2, phospho JNK1/2 and HO-1 protein after exposure to EA in RASMCs.
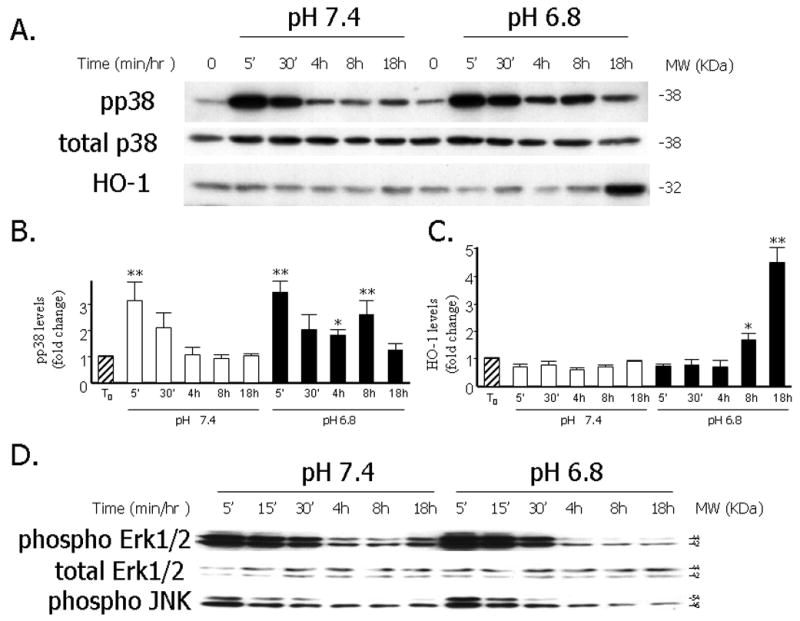
A. Representative Western blot depicting levels of pp38, total p38 and HO-1 protein after exposure to EA (pH 6.8) or media of physiologic pH (7.4) for different time periods. B. Quantitative analysis of levels of pp38 (normalized to total p38) following exposure to the experimental conditions. Data are expressed as the mean and standard error of the mean (SEM). Eight independent experiments are represented. *: p< 0.05, **: p< 0.001, statistically significant differences as compared to T0. C. Quantitative analysis of levels of HO-1 (normalized to α-tubulin) following exposure to the experimental conditions. Data are expressed as the mean and standard error of the mean (SEM). Eight independent experiments are represented. *: p< 0.05, **: p< 0.001, statistically significant differences as compared to T0. D. Representative Western blot depicting pErk/1/2, total Erk1/2 and pJNK1/2 protein levels after exposure to EA or media of physiologic pH for different time periods.