Figure 5.
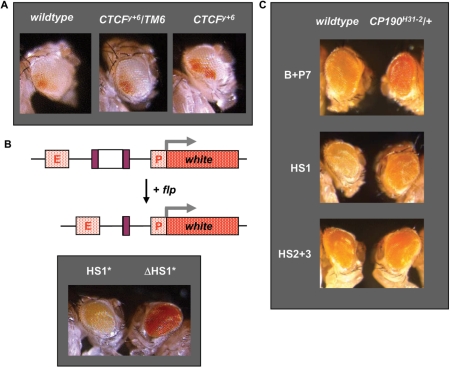
Boundary activity in the HS1 region. (A) Eye colour of representative heterozygous flies of transgenic line HS1 170.2 in wild-type and heterozygous and null dCTCF mutant background. (B) Schematic representation of the enhancer-blocking construct; E and P represent the enhancer and promoter of the white gene and HS1* and FRT sites are depicted by white and purple rectangles respectively. Eye phenotypes of representative heterozygous flies of transgenic line HS1* 34.2 before (HS1*) and after (▵HS1*) flp action are presented below. (C) Eye colour of representative heterozygous flies of transgenic lines B+P7 2.5, HS1 1.3 and HS2+3 3.1 in wild-type and heterozygous CP190 mutant background.

