Figure 3.
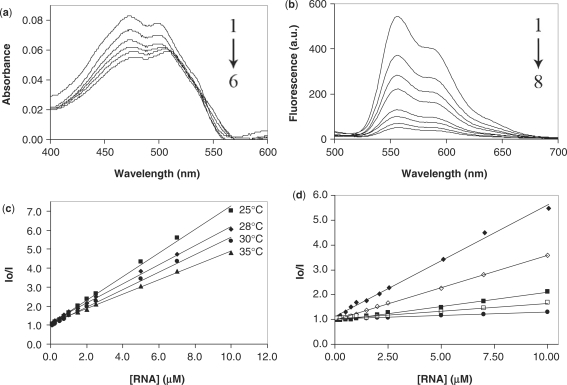
(a) Absorbance profiles of 7 µM DOX in the presence of (from 1 to 6) 0, 0.5, 1.0, 2.5, 7 and 20 µM ferritin H-chain IRE RNA. (b) Fluorescence profiles of the titration of 7 µM DOX with (from 1 to 8) 0, 1, 1.5, 2.5, 5, 7, 10 and 15 µM ferritin H-chain IRE RNA. (c) Stern–Volmer plot of 7 µM DOX with ferritin H-chain IRE RNA at the indicated temperatures. (d) Stern–Volmer plot of 7 µM DOX with ferritin H-chain IRE RNA in BPE of the following Na+ concentrations: 16 mM (filled diamond), 46 mM (open diamond), 116 mM (filled square), 216 mM (open square) and 516 mM (filled circle). Each Stern–Volmer plot was obtained from an average of at least four independent experiments.

