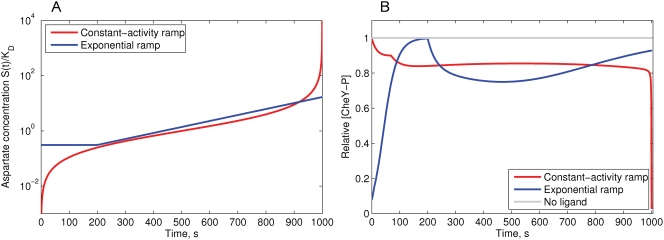
Figure 2. Simulation of the MWC model response to the constant-activity and exponential ramps of aspartate.
(A) The concentration profiles of constant-activity and exponential ramps of aspartate, relative to KD = 4.52 µM (logarithmic scale). (B) The response of the MWC model to the applied constant-activity and exponential ramps. Upon stimulation with the constant-activity ramp, the [CheY-P] rapidly goes down during initial excitation—the single non-smooth point on the slope is the result of the piece-wise linearity of the methylation energy function. The constant-activity ramp produces a long flat response up to a concentration of 100KD, above which Tsr receptors become sensitive to the ligand and the cluster activity falls. Upon stimulation with the exponential ramp, the cell initially adapts to the minimum concentration Cmin = 0.31KD, and after 200 s the exponential ramp begins. After 700 s, adaptation overcomes excitation and [CheY-P] slowly returns to the steady state. Relative adaptation rate k = 1.

