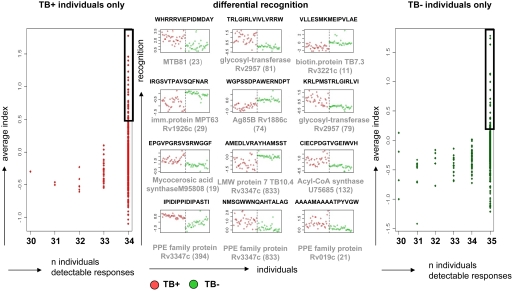
Figure 3. IgG recognition of MTB epitopes segregates TB+ (marked in red) and TB− (marked in green) individuals.
The left panel shows the peptides that gave a detectable response for 34/34 individuals with TB but were never recognized in any sample from 35 TB− individuals. Conversely, the right panel shows the responses of peptide epitopes that were recognized by 35/35 TB− individuals but not recognized by any of the 34 TB+ individuals. A predictive analysis using PAM found 89 peptides differentially recognized by TB+ and TB− individuals with a classification error of approximately zero. The center panel plots the ‘top 12’ most strongly predictive of these: the header of each plot shows the peptide sequence, and the corresponding protein with the accession number and the location of the peptide (given in brackets) within the protein is listed under each plot. A compilation of the ‘top 24’ responses (boxed) of the peptides recognized exclusively by TB+ or TB− individuals (left and right panel) segregated by proteins are compiled in Supplementary Table S4 online. Segregation between TB+ and TB− does not cluster into specific recognition of certain MTB proteins, but rather into specific peptide epitopes at different locations within the same protein.

