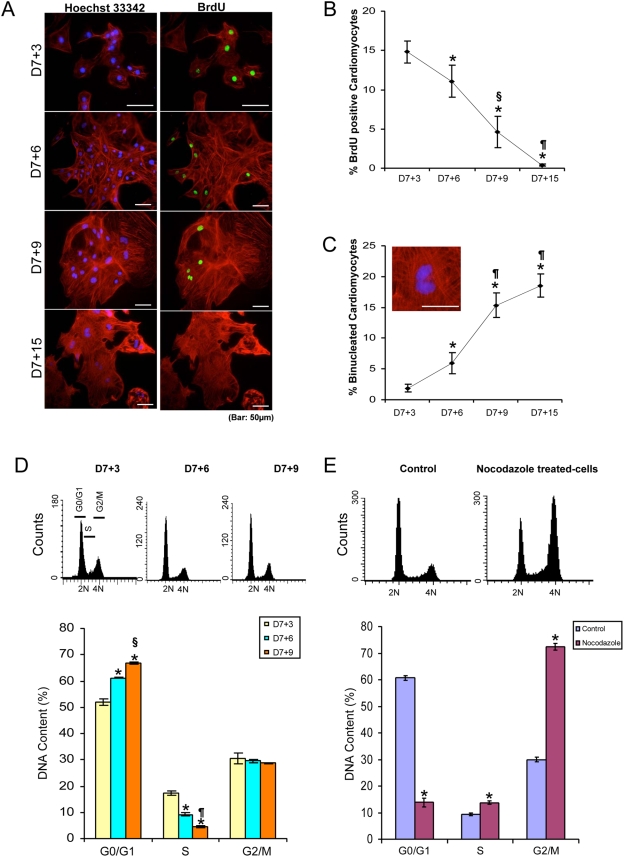
Figure 4. Early stage CM actively progress through the cell cycle.
A) BrdU positive (green, S phase), cTnT positive (red) cells were routinely observed at early time points after selection, but only rarely at late time points. Bar = 50 µm. B) Graph depicting the percentage of BrdU labeled CM as a function of time (*, P<0.005 vs D7+3, §, P<0.05 vs D7+6, ¶, P<0.005 vs D7+6, ∫, P<0.05 vs D7+9). C) Graph showing the percentage of binuclear CM stained with both cTnT and Hoechst 33324 (Bar = 50 µm) between D7+3 and 7+15 (*, P<0.005 vs D7+3, §, P<0.05 vs D7+6, ¶, P<0.005 vs D7+6, ∫, P<0.05 vs D7+9). D) DNA content was measured on PI-labelled fixed cells by flow cytometry, and the relative positions of G0/G1, S and G2/M phase cells are shown. The graph indicates the number of cells in each phase of the cell cycle as a function of time (*, P<0.05 vs D7+3, §, P<0.05 vs D7+6, ¶, P<0.05 vs D7+3). E) DNA content analysis of 120 hour nocodazole-treated cells and percentage of cells in each phase of the cell cycle. *, P<0.005 versus control.

