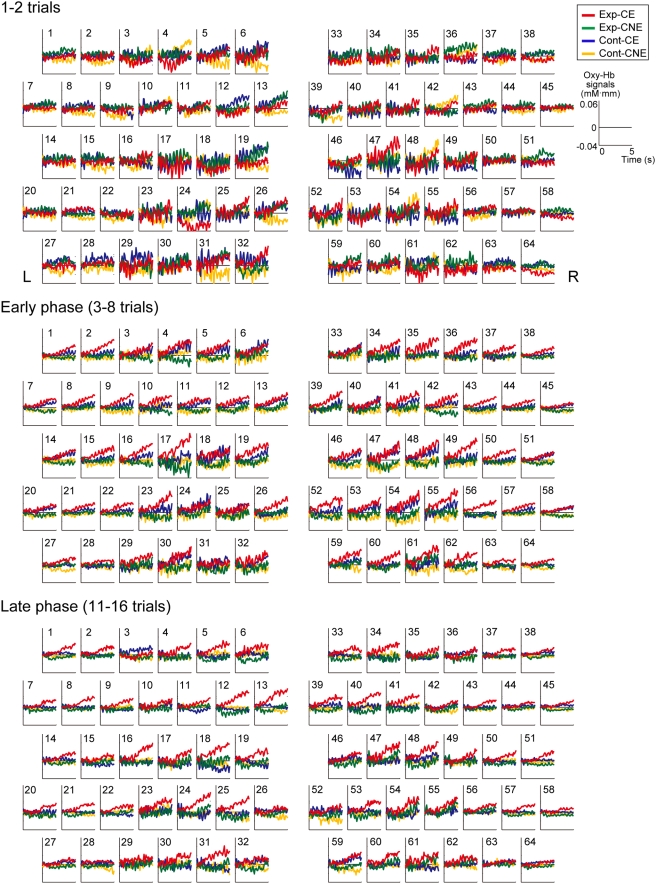
Figure 3. Changes in hemodynamic responses to the cue in three phases.
The arrangement of panels is the same as that of the measurement channels shown in Figure 1B. The red, green, blue, and yellow lines indicate the averaged time courses of oxy-Hb signals for the first 5 s under Exp-CE, Exp-CNE, Cont-CE, and Cont-CNE, respectively.

