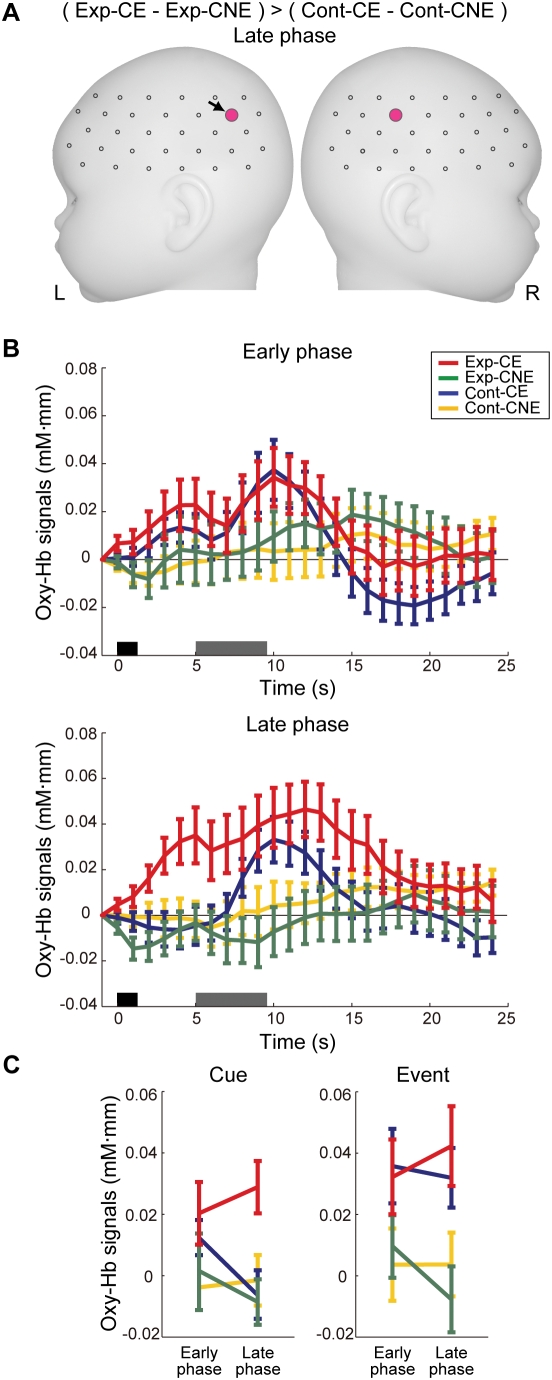
Figure 5. Cortical regions showing increase in oxy-Hb signals before the onset of the event.
(A) Cortical regions showing specific activations in response to the cue of Exp-CE. The mean signal differences between Exp-CE and Exp-CNE were compared with the differences between Cont-CE and Cont-CNE. Pink-filled circles indicate channels that surpassed p<0.003. (B) Changes in hemodynamic responses between phases under each condition in the left temporoparietal channel (Ch12, black arrowed in Figure 5A). Error bars indicate standard errors among the infants. The dark gray bars and light gray bars indicate the cue period and the event period, respectively. (C) Changes in the magnitude of hemodynamic responses to the cue and the event between phases in Ch12. These values for the cue and the event were derived from the calculation of the mean signal changes of oxy-Hb averaged in a time window from 4.0 to 5.0 s and from 9.5 to 11.5 s after the cue onset, respectively. Error bars indicate standard errors among the infants.

