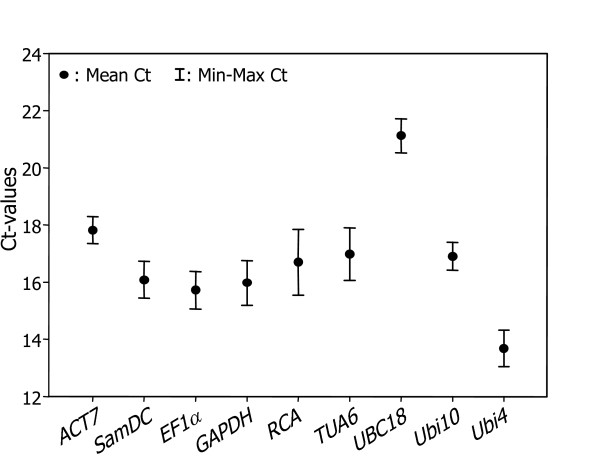
Figure 1.
Expression levels of candidate reference genes in different plant samples. The scatter plots exhibit the expression levels of candidate reference genes in the tested Brachypodium samples (n = 21). Values are given as cycle threshold numbers (Ct values) with a mean of duplicate samples. Bars indicate standard error of the mean.

