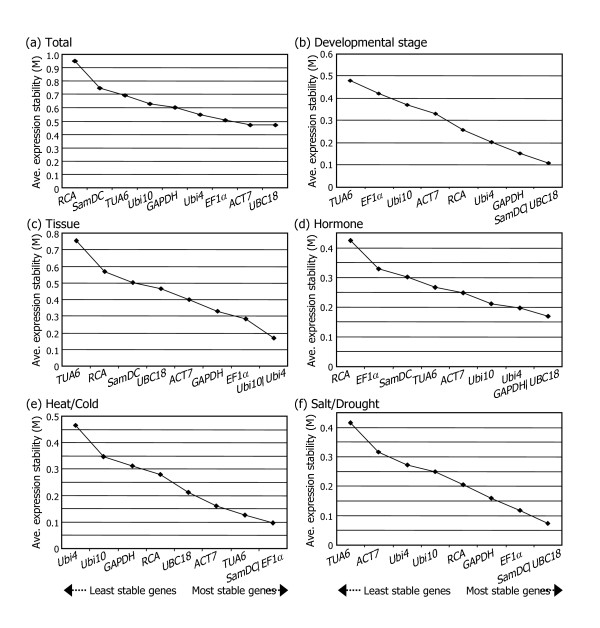
Figure 2.
Average expression stability values (M) of the candidate reference genes. Average expression stability values (M) of the reference genes were measured during stepwise exclusion of the least stable reference genes. A lower M value indicates more stable expression, as analyzed by the geNorm software in plant samples at different developmental stages (b), plant tissue samples (c), hormone-treated samples (d), heat- and cold-treated samples (e), and in high salt- and drought-treated samples (f). The M values calculated for all plant samples examined are also given (a).

