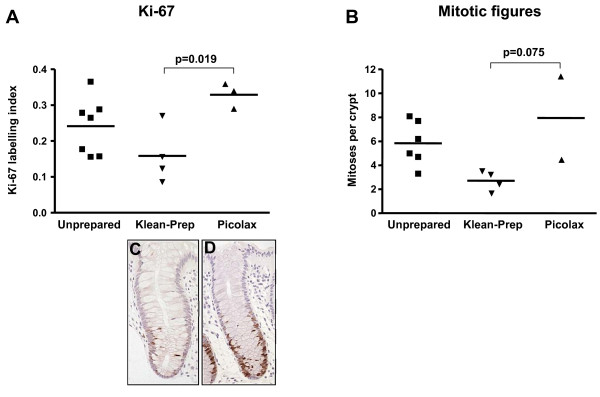
Figure 3.
ANOVA of Ki-67 and mitotic figures in unprepared and prepared bowel. Significant differences were seen between all groups (p = 0.035 and p = 0.045 for Ki-67 (A) and mitotic figures (B), respectively), with a marked difference in Ki-67 between Klean-Prep and Picolax (p = 0.019). Crypts with a low Ki-67 LI, from a bowel prepared with Klean-Prep, and with a high LI, from a Picolax prepared bowel, are shown in B and C, respectively.

