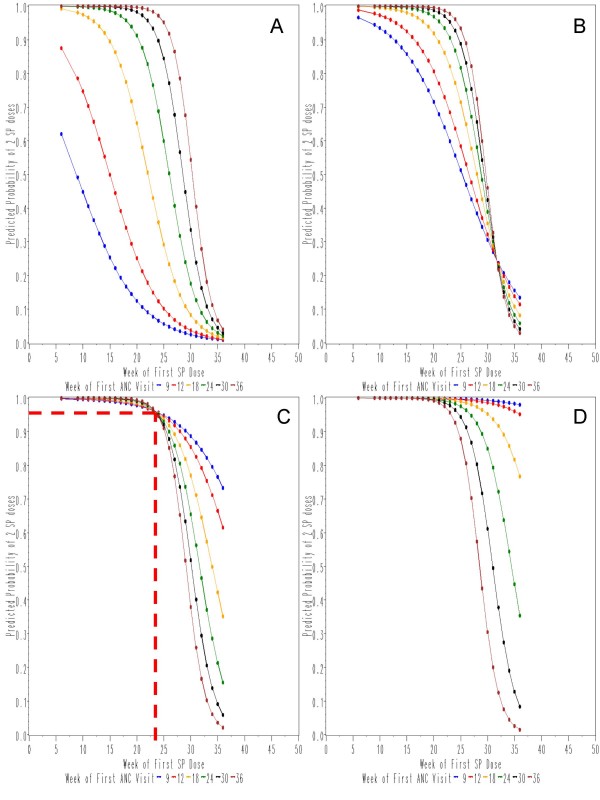
Figure 4.
Logistic model of the probability of receiving two SP doses for women with recorded delivery, date of first visit and SP administration. The panels are for women with < 3 (A), 3 (B), 4 (C) and 5 (D) antenatal visits. For ease of reading only the calculated curves for weeks 9, 12, 18, 24, 30 and 36 of the first SP dose are presented. [Note: The point of equipoise is depicted as an example in panel C: when the number of antenatal visit is = 4, the probability of 2 SP doses is = 0.96 at the week of first SP dose = 23 when the week of first ANC is either 9, 12, 18, 24, 30 or 36].

