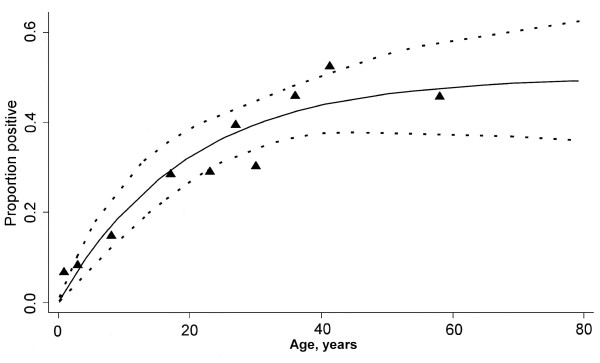
Figure 4.
Age specific seroprevalence plot of anti-MSP-119 antibodies. The vertical axis shows the proportion of seropositive individuals in each age group, the horizontal axis shows the midpoint age of each age group. Filled triangles represent the raw data; the lines represent the fitted equation with parameters λ = 0.026 and ρ = 0.026 and the 95% confidence interval.

