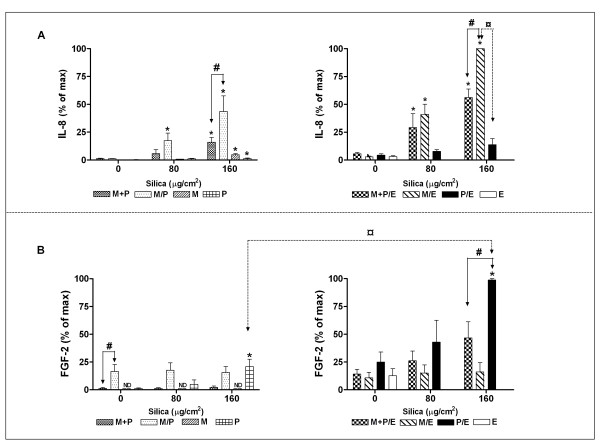
Figure 2.
The release of IL-8 and FGF-2 from monocultures and co-cultures of monocytes (M), pneumocytes (P) and/or endothelial cells (E). The cells were combined into non-contact co-cultures (M/P, M/E, and P/E) and contact co-cultures (M+P and M+P/E), and exposed to silica (80 and 160 μg/cm2) for 43 h. A: IL-8 (mean of max ± SE = 110583 ± 31940 pg/ml). B: FGF-2 (mean of max ± SE = 269 ± 134 pg/ml). ND = not detected. Data represent means ± SE for n = 4 – 5 separate experiments. *P < 0.05 shows statistical differences of exposed cultures vs. controls. #P < 0.05 shows statistical differences of exposed non-contact co-cultures vs. contact co-cultures. ¤P < 0.05 in A shows statistical differences of exposed non-contact M/E vs. P/E co-cultures, and in B shows statistical differences of exposed non-contact co-cultures of P/E vs. P. Data for IL-8 were log-transformed before performing ANOVA.

